Hi all,
I have a cross-over study, each subject dosed three time (three food states) and each time his laboratory data was remeasured. Basically at this stage I want to use the base model to diagnose if any covariate change affects the parameter.
As I didn’t select anything and want to diagnose from the eta-covariate graph, it only reports one eta-covariate for each ID. If I select the connection (say HDL with Cl), then it assumes the effects exist and I can’t recheck from the eta-covariate graph any more. So I wonder at this stage how can I diagnose the potential covariates from a large pool (many combinations)???
Please notice that I have tried IOV and reset option, but as I mentioned above, I can only check the box to compare one at a time, rather than check all the eta-covariate graph (which can be done is non cross-over study and each ID has one set of covariates) , as it only reports one set of parameter for each ID rather than one?
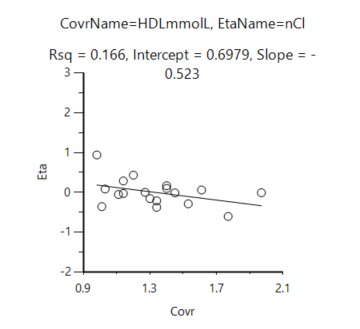
The fig below shows a typical eta-covariate graph, which contains all IDs, but only connect with the HDL in the first dose.
I also want to ask in a general way, if a covariate (biomaker) changes with a parameter (clearance) as the time varies, possible to report the Cl at each time point so a eta-covariate can be ploted? Or I can only try this through trial and error and compare the optimization each time?
It also comes from the curiosity when it talks about the direction for covariate (forward, backward, interplacte), I wonder where I can see this subtle operation happen?
please look at the help for this setting on covariates, it is how interpolates between supplied values for that measurement e.g if you weighed the patient every 7 days, how would you estimate their body_wt on day 4
https://onlinehelp.certara.com/phoenix/8.3/index.html#t=topics%2FStructural_sub-tab.htm&rhsearch=covariate%20forward&rhhlterm=covariate%20forward&rhsyns=%20
- It is important to note that covariates have a direction of propagation that is forward in time, back ward in time, or linearly interpolated.
Illustration of propagation direction
The default is forward in time, to be somewhat consistent with other tools. (Refer to “Structure tab” for setting the direction.)
Thanks Simon, I had read through all these guidance/library/help and asked the above questions. I understand the setting principles. Maybe I didn’t express it clearly.
I mean based on the fact that I set a time-varying covariate properly, is there a table that can show the change of fixed effect? As the theta table only show one set of parameters. Is there are way to back-check the parameter output.
On the Run Options tab. Create tables with given timepoints where covariate values and etas are requested. After that you can then plot the results as you need.
it is also better to have occasion defined and modeled to help in visualizing the time varying effects
https://pubmed.ncbi.nlm.nih.gov/15373929/
unless you jointly model the covariate and the DV in effet you are using a time varying step function
more modern methods like FREM can handle missing time varying covariates naturally
https://www.ncbi.nlm.nih.gov/pmc/articles/PMC6820681/
Thank you that really helps.
What is the median/mean from the covariate in Structure tap calculated from? Is it per subject or per sampling points?
Is it suggested to have a centered covariate column prepared myself rather than relying on the model structrue to center the data? As when I verify the individual parameters from these results, the median is not really the data median (v8.1) either per subject or per anything.
Thanks
I was told to work out the appropriate centre for the population(s) of interest. AS you say this is a quick option to get median or mean for this collection of subjects but if you want your data to be more easily translatable perhaps you might centre on 70kg for body weight.
example vpc using Food as IOV and covariate and vpc by this covariate
VPC_IOV.phxproj (1.31 MB)