I found good improvement in plots in additive error with -2LL not as good as in multiplicative error model. Whereas the plots in multiplicative not as great as in additive. In both the cases, the number of covariates added are same.
As far as I understood from different opinions of experts and literature, the diagnostic plots would be normalised i.e, the error will get minimised & simultaneously their pattern would improve with the addition of covariates.
My querry is
why is the additive error model is not yielding better -2LL inspite of bringing goodness in diagnostic plots.
what is the best approach to select a good error model? Is it Objective function value or diagnostic plot.
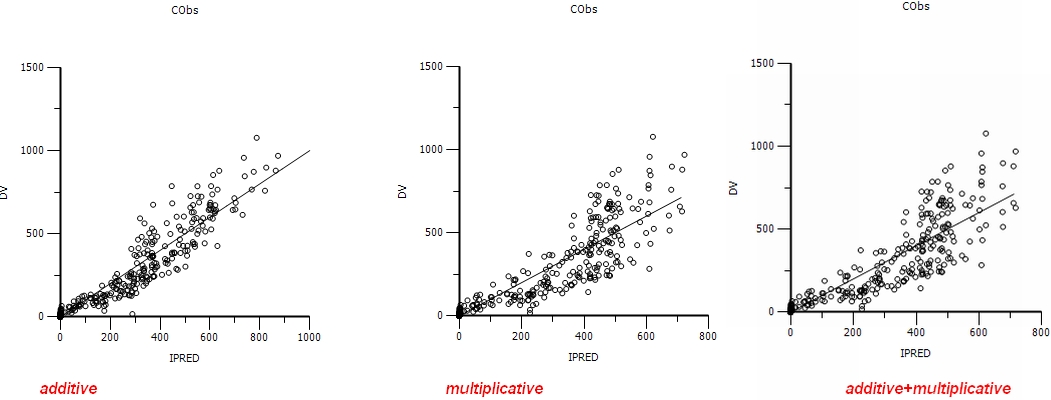
I welcome your inferences after referring the three attached files (CWRES vs PRED, DV vs IPRED and DV vs PRED)containing plots for additive, multiplicative and additive+multiplicative error models respectively in each.
Vijay, I think it would be interesting to know the actual change in -2LL and to see your original project, can you post that?
I am not sure if you have got the best structural model, plus there is something very odd with these plots that makes me wonder if dose or units were changed between models?
because the PRED units are changing by an order of magnitude in your plots;
Thanks for your response. Please find the below attached run file containing additive and multiplicative error models. I did not included Additive + multiplicative model as it is shooting up the -2LL to very high value.
Could you explain how can the Cxx treatment parameter added as Inter occation (in place of categorical) variable in the error model.
By the by if this data perform for bootstrap and VPC, what else can be checked in addition to CI of parameter distribution. Would it show any impact to this data?
Thank you
VIJAY KUMAR SRIPURAM
Dr Reddy’s Institute of Life Sciences
University of Hyderabad
Hyderabad, AP, India. [file name=Cxx_treatment_influence_on_FEXO.phxproj size=2620826]Certara | Drug Development Solutions (2.5 MB)
OK there were quite a few things to address to get this running better.
1: This is a cross over study and the time is reset to zero in each period. You need therefore to uncheck the sort option and add a reset column being 4 (arbitrary) every time you have a dose (you must keep the order sorting by id then by treatment).
2: You click on input options and check the reset button with 4 as lower as 4 as upper. The program then will washout the drug every time he sees reset=4 (cross over assuming full washout when shifting treatment), i.e. each period is being treated independently.
3: I ran NCA quickly and saw a factor 1000 error in the estimate of V and Cl. I fixed it and used the NCA estimates for V and CL with V2 and Cl2 =V and Cl for initial estimates
4: When you have a data set, you should remove both the 0 doses and the zero concentrations. The zero concentrations are not realistic and not right and the 0 doses do not do nothing, the BQL options would be better
5: The model you developed assumes constant error. A quick examination of the CWRES reveals that a better error model would be proportional
6: You are better to use FOCE ELS and not FOCE LB, especially when you shift to proportional error
I will try and clean up your project and re-post but I’m holiday this week.
Note that there is no covariate relationship in your current model.
I hope that helps.
Dear Simon Davis, Thanks for your information. This should drive me to the goal in a thought provoking manner. One more error I observed is ‘CMixratio’ value in mixed error model. As per one Nick, “it is the ratio between coefficient of variance in additive model to the Standard deviation in proportional error (CV2SD)”. And in phoenix user guide “type a name for the mixed ratio parameter in the mix Ratio field or accept the default name.– CMixRatio is the default mixed ratio”. The default name is turning into red after the run. I believe still there is some error. Thank you VIJAY
Dear Vijay
Although it turns red, it does not seem to be an error. Here is an example with both mixed ratio and proportional error. In this simulated example, proportional is the right model and you can see that -2LL is not improved with mixed ratio, sign we should stick with proportional error.
best
Serge [file name=cmixratio.phxproj size=1334971]Certara | Drug Development Solutions (1.27 MB)
Dear Serge and Davis, Thanks for your valuable inputs. I came back with another issue with this model. In NONMEM, bioavailability parameter can be added to see the covariate effect(such as F = THETA(y)**COMD). How can it be modeled in phoenix NLME? It might be useful in my project. Thanks in advance. VIJAY KUMAR SRIPURAM
Dear Vijay
I generated a simple model that illustrates how to incorporate bioavailability as its dependence with covariate. In this example, we have a one compartment model, extravascular input with bioavailability depending on dose. I did not add IV dosing and to be user of full identifiability, we may do that but it is just an illustration of how to model that in NLME.
1: You use built in extravascular input one compt model
2: you copy the model and shift to graphical. You click on the extravascular compt and click on bioavavailibility option and write for example F
3: you define F as a model parameter (click inside any empty space within the graphical area and select insert/model parameter and write under the graphical area F
4: click on parameter structural “add from unused” and select dosing as covariate
5: on the same window select ilogit for F to make sure it will be between 0 and 1
6: put also a covariate relationship between F and dosing (click on F and choose the Yes option)
7: Now you can fit the model to the data
I hope it helps
Best
serge [file name=F_covariate.phxproj size=1914132]Certara | Drug Development Solutions (1.83 MB)
Dear Vijay, The CMixRatio text appearing as red in graphical models is a defect that has been fixed since the last release of Phoenix. It is only a cosmetic defect. It does not affect using the model. Regards, Linda Hughes
Hello Serge and All, How to determine inter occasion variabiliy for Bioavalialability or AUC along with CL/F, V/F. This is important to explain pharmacokinetic drug interactions. Thanks in advance VIJAYKUMAR SRIPURAM
Dear Vijay I think that the easiest way for your specific issue is just to run a non compartmental analysis where you sort by both ID and treatment. Since you have rich data, the NCA will give you good estimates of both AUC and Clearance for both treatment and patient. Once you have that, you should ask statisticians to run the right test to determine if you have a statistical difference between treatment. I am thinking about the pair t test as it is a cross over study. Best Regards; Serge