How to Overlay Observed Data on NLME Simulation Plot

Hi there,
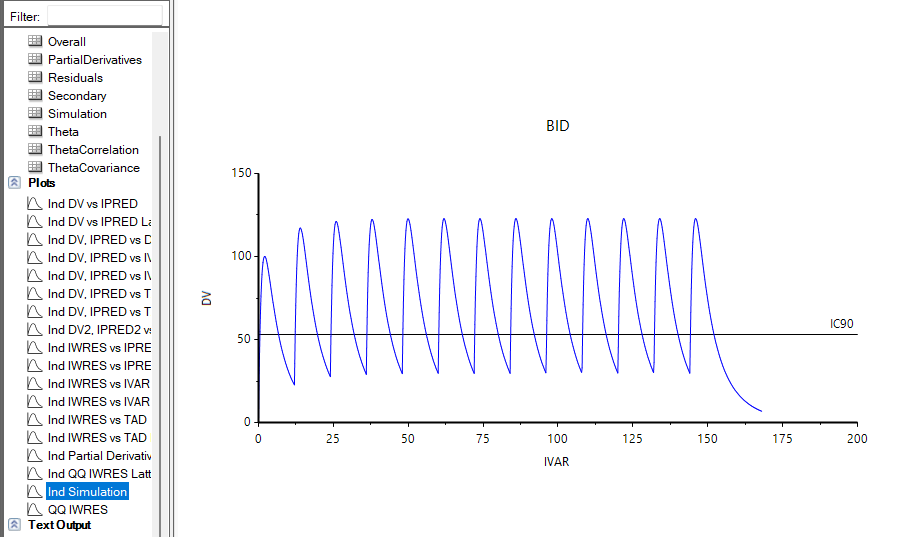
I’m currently working on an NLME simulation job. I used a mixed-effects model to simulate the steady-state PK profile and reviewed the Ind Simulation plot in the output. The plot shows only the simulated concentrations, not the observed data.

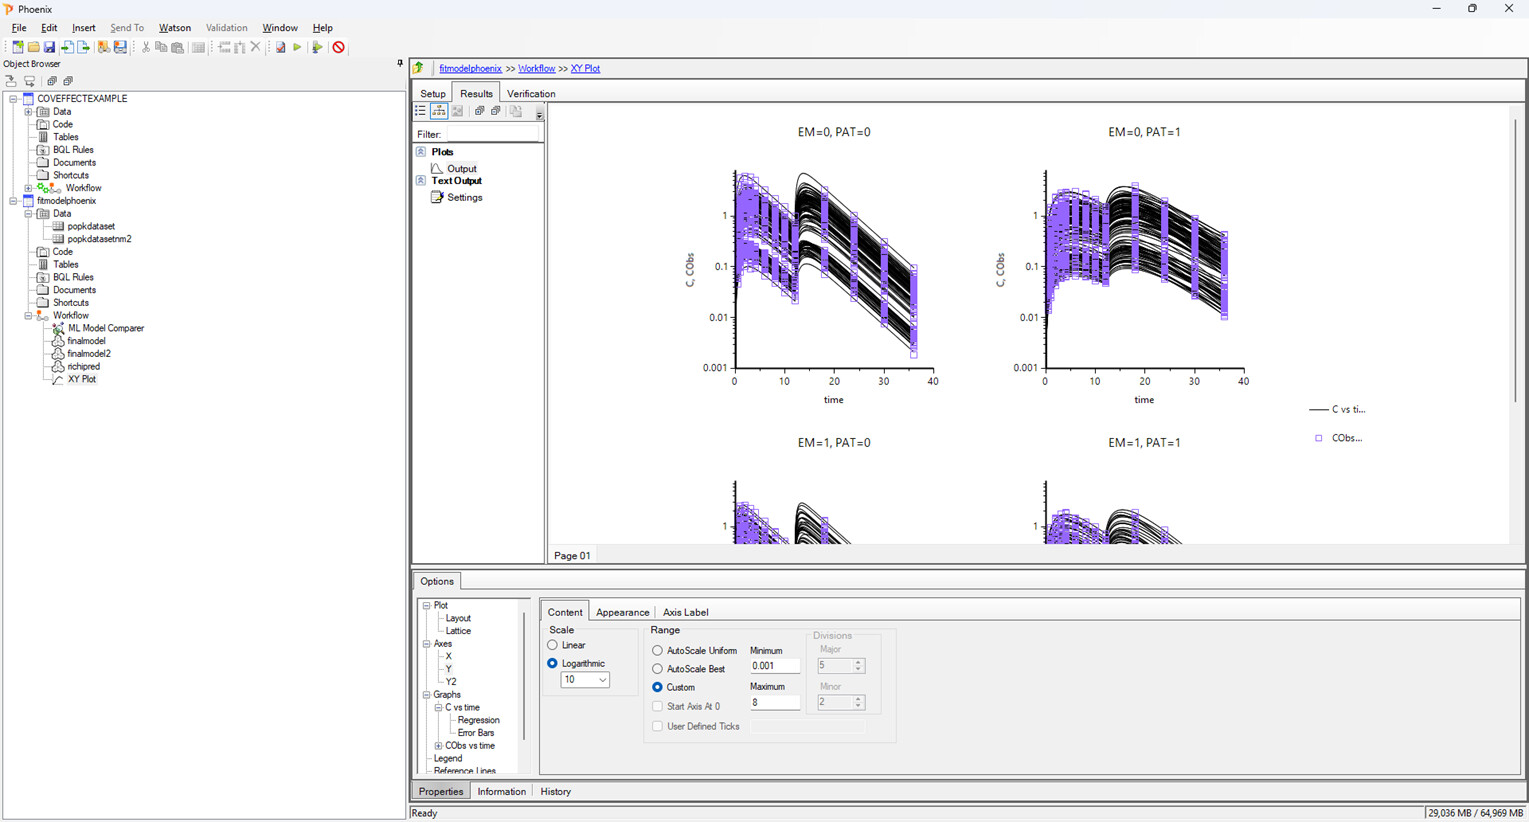
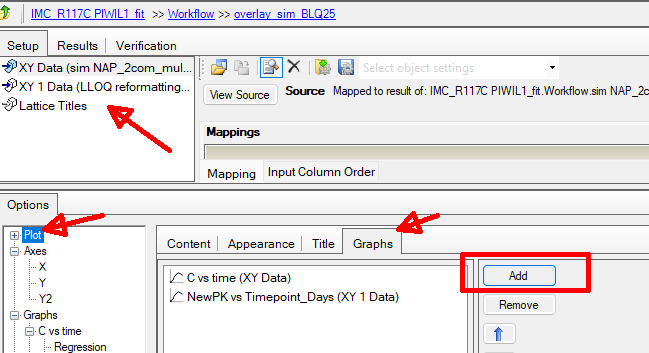
I’d like to compare the simulated concentrations with the observed concentrations by overlaying them in the same plot, but I couldn’t find an option to do this within the NLME interface.
Could you please guide me on how to incorporate the observed data points into the simulation plot? Any help would be greatly appreciated.

you will have to do a separate plot using the buitl in xy plot object where you add another source for data which has the observed dat and the simulation table for the simualted profiles


Dear Samer,

Oh, I see. Thank you for the method. I’ll use it with another ‘XY Plot’ function.

In case you aren’t aware it is very easy to overlay data from different worksheets by using the option to “Add graphs” which when clicked will add additional mapping inputs. Simon.

1 Like

Thank you, Simon. I didn’t know that function. It is very helpful to use.

1 Like