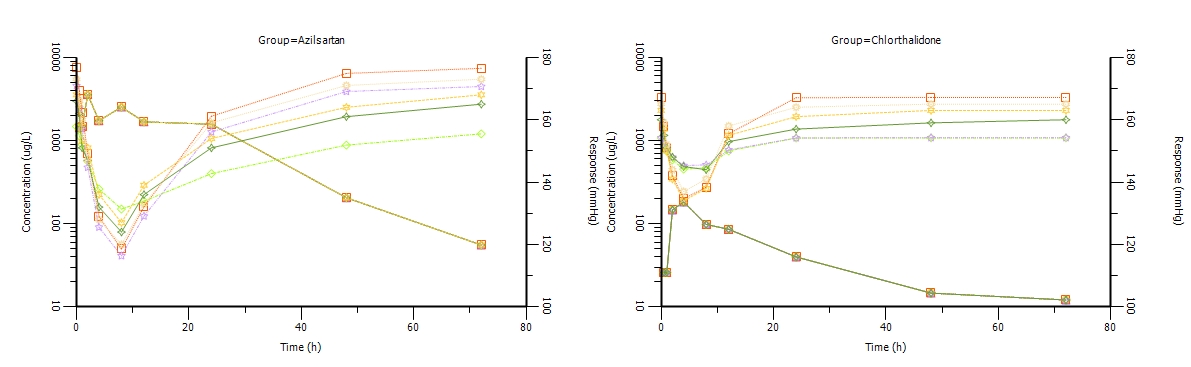
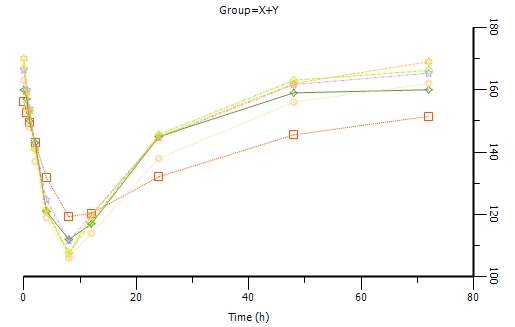
Hi aal, the objective of our study was to develop synergistic PK-PD interaction between two drugs X and Y for anti-hypertensive activity. We have tried to develop e the interaction model through Indirect response models that simultaneously act on different rate processes Kin and Kout. Naive pooled method was use for analysis. But we faced following problems in modeling 1. we could n’t be able to get precise parameter estimates 2.We could not be able to get estimates of Emax and EC50 Kindly suggest the corrections to be made in model code if any, or suggest the wys to refine the model in terms of ensuring good parameter estimates. The phoenix file was attached below.
X+Y15.03.16.phxproj (396 KB)
Dear colleague
I think your model does not have a dose response relationship we can assess. When this happens, Emax and EC50 are usually not identifiable. May be their ratio is identifiable but not both independently.
You have 6 subjects and even a population approach(see attached last model) will show you se in % going to infinity. You have same number of parameters than subjects.
The fact that you put boundaries does not help you assessing precision for your parameters
I updated your project and sued a population approach (naïve pool but population check box) and the fit is excellent but overparametrized in the sense you can estimate both Emax and EC50.
This is what I think.
Best
serge
AZ_CLT_serge_corrected.phxproj (2.27 MB)
Hi Santosh, I was looking at your data in parallel to Serge and I wondered if there was any more data you could supply; if I understand your file well you have give us ?mean conc for the indivula treatemtns and no concentrations at all for the co-administered group?
If you have access to some more information perhaps a better model can be fitted ?
Simon
Hello Mr.Simon Davis,
Thank you for your reply. the combination group has the effects of drugs X and Y combined. the plasma concentrations of combined drugs consisted of plasma concentrations of X in combination and Concentrations of Y in combinations. And that data I am attaching in the form of excel sheet.
++++++++Edits by SAA Davis++++++++++++++++++++++++++++
Santosh,
Please find CSV and XLS files of your full data attached. You may need to click the button ‘use full editor’ to be able to add attachments.
My question was why were you using mean conc data when you had individual data for the PD? Also in the last data you gave below you have an extra timepoint for 0.25 that was not present in any of the previous sets; is there PD data for this in the combination group (or indeed the individual groups?). As Serge says it maywell be an identifiability issue, but I think it would help you to have the most data you can.
Simon.
Append AZ_CLT.xls (25 KB)Append AZ_CLT.csv (12.6 KB)
Sorry I was unable to upload excel sheet Time Mean Concentration of AZ in combination h ug/L 0 0 0.25 819 0.5 1280 1 1175 2 3577.5 4 2320 8 1330 12 1470 24 1325 48 216.1 72 43.6 Time Mean Concentration of CLT in combination h ug/L 0 0 0.25 29.85 0.5 7.75 1 54.85 2 114.15 4 190.8 8 110.5 12 89.33 24 38.2 48 15.5 72 6.255