Hello, I’m trying to make a population model in phoenix. Idon’t have any issues with a single dose but it doesn’t work with repeated dosing using an ADDL (aditional doses) column. Is it better to consider each sample day as a different subject? Do I have to use the Day as a covariate ? Thank you
Dear bstk I generated a simple example showing how to simulate population data with ADDL. The project is attached. In order to simulate this kind of data, you need the additional columns called ADDL and a column where you put the dosage interval. Let say I called here that column II (case sensitive, do not forget). The model here is a 1 compartment model with IV Bolus. The template file where I am putting the dosing information looks like that ID TIME CObs DOSE ADDL II 1 0 0 100 5 7 2 0 0 10 10 3 You decide on the model parameter characteristics as usual (here V=50, Cl=3) and both variances in the log-domain of 0.1 (~30% cv) Now, you click on input opiotns and select ADDL option. Then you can see on the right again ADDL and Add underneath, click on Add. You see then Delta Time, Dosepoint and Amout Delta Time: the default option is constant but here we want to use the column II. Therefore, click on constant and it will change the column which is what we want. Write then on the right (empty rectangle) II. Phoenix is case sensitive, therefore put upper case as showing up in the data set Dosepoint: This is the compartment name where the dose is given. Here it is A1. Therefore write A1 on the right of Dosepoint (inside the empty rectangle on the right of Dosepoint) Amount: click on constant , it will change to column: the column where the dose information shows up in our data set is called DOSE. Therefore write DOSE on the right of Amount Now, I want a simulation table. Click on run options and select the last option (sim/pred checks). Put 0 as number of iterations (on the right of N iter) Under predictive checks options, click on Main and put let say 100 for the number of replicates. The program will simulate 100 times these 2 patients (1 and 2). click on Tables and select sim table Now on the right of Times write seq(0,50,1) . this means that you will get simulations from time 0 to 50 by interval of 1. on the right of variables: write C, CObs . C is the predicted response defined in your model and CObs is the observed response as defined in your model (look at the code). C = A1 / V (predicted response) error(CEps = 0.1) (sd of your error model) observe(CObs = C * (1 + CEps)) (observe response) Now you can run the simulation and you will see 2 files when clicking on results. The first one is not relevant here as I put in my data set only the dosing information. The second is the simulated table I requested. Let me know if you need further help. best Serge [file name=addl_example.phxproj size=775763]Certara | Drug Development Solutions (758 KB)
Thank you very much for awnsering so quickly, you taught me something i didn’t know about simulation tables. But my problem is not about simulation. I’m working on a dataset derived from a repeated dosing (each day) study with different sampling days. I managed to fit one subject at a time taking into the repeated dosing. What I really want to do is to fit a population model that takes into account all the subjects with all their dosing and sampling days history. I know that one solution could be to consider each sampling day as a different subject or using Day as a covariate but the model fails to converge. Is there an other way ? And do you know the best the best minimization engine to fit this kind of data (I’m actually using the FOCE-ELS) ? Kind regards. Majd.
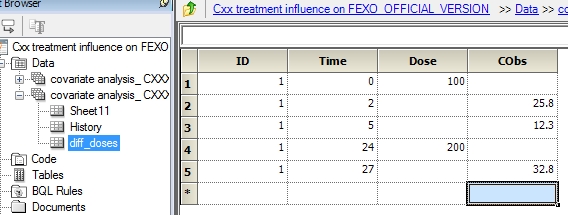
Dear Majd Can you share the data set? That would be the easiest way. Now if not, I can only give you advises. The same way I simulated data with ADDL and II, the same strategy can be used for fitting. The time column (in hours for example) will have the time since the first dose (first day) starting t=0. Let say that the dose was the same within the same patient but given every day and let say the dose is 100. You gave total of 20 doses (suppose) every day. Then you have the ADDL column with the number 19 (the dose at t=0 + 19 additional doses) and the column II with the number 24 at time t=0. suppose you observe the response at t=1,25,36,47,92. Then you have these times added on your data set with the value of the response (CObs column). An example is shown (for one patient )below (with arbitrary response values). The same applies for each patient (always put integers for patient numbers to be sure all outputs will be available) id time dose CObs ADDL II 1 0 100 19 24 1 1 22 1 25 23 1 36 12 1 47 23 1 92 4  There is no reason to put day as covariate. If the dose change each day, then you do not use ADDL and II but just write in the data set each dosing row. For example, patient 1, dose 100 on day 1 (t=0), 200 on day 2 (t=24) observation at t=2 , 5 and 27(I put arbitrary values for the response). then you will have something like that id time dose CObs 1 0 100 1 2 25.8 1 5 12.3 1 24 200 1 27 32.8
  I hope you can share the data and then I will be able better to assist you. best Regards; Serge

Thank you serge, Unfortunately I’m not allowed to share the data by my company. I transformed the dataset as you did but still, it works individually even il the fit is not quite good but the population model fails to converge. I have another question when you compare different models. I read that you can’t compare the objective function or Akaike criterion of models with different erreor structure is it right ? Kind regards. Majd.
Dear Majd As long as the bigger (full)model can be transformed into the smaller (reduced) model by fixing one or more parameters to a specific value, then you can test statistically if the bigger model is better than the smalerl model. For example, reduced model being only additive error and full model mixed error model. One parameter added and you can come back to additive by fixing Cmixratio to zero. When you cannot do that, then you can still say that the model with lowest -2LL may be the best but you cannot compute any p value. In that situation, AIC and BIC criteria are usally used (the smaller is the best) but again no p value can be evaluated. Best Regards; Serge
Dear Majd, Just to add to Serge’s comment: your statement about not being able to compare the OFV and AIC is correct if you are referring to NONMEM. In NONMEM, the full likelihood is not preserved in the OFV calculation, so the OFV for a model with additive residual error is not comparable to the OFV for a model with multiplicative residual error. However, in Phoenix, the full likelihood is preserved and is used for the calculation of -2LL. Therefore, in Phoenix, you can use -2LL, AIC, and BIC to compare models that use different residual error structures. Best regards, Helen Moore
Ok, thank you very much. I also have another question (excuse me but i’m quite new in the world of NLME). The algorithm for my population model fails to compute de CV% of the parameters estimates with other error structures than the additive one. I use the FOCE-ELS engine. Do you know why ? Best regards. Majd.