Hello all!
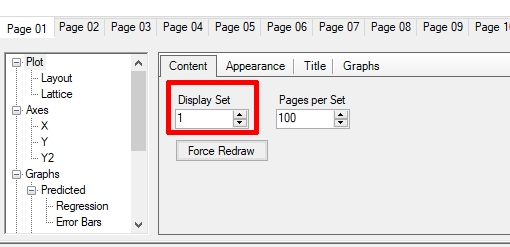
When doing an NCA in Phoenix WinNonlin the maximum number of plots shown under “Results>>Plots>>Observed Y and Predicted Y vs X” is 100. When sample size is large enough (N>50 in a 2-period designs, N>33 in 3-period designs…), one cannot see all plots under this section as the maximum number of plots shown is 100 (for example in a 2-period design there are no plots of subjects over #50). Is there any way to overcome this problem so that we could see all of the plots?
Best regards,
BEQool
