If it would be possible to add another graph something like this mock-up would be possible: 
QC11454 is a somewhat related existing issue; “overlaying the observed data on top of a box plot”, but it does not currently cover Jitter in it’s request. Of course we could build something manually very similar to the box plot using overlays with XY plot. Simon.
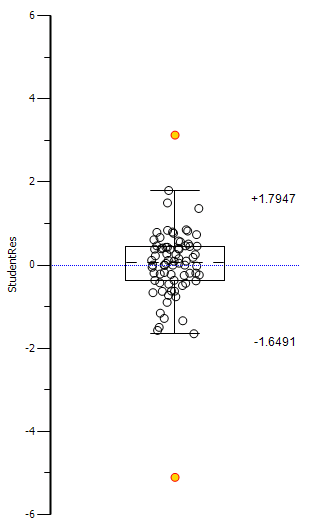
I think adding jitter is luxury – though useful. [quote]Of course we could build something manually very similar to the box plot using overlays with XY plot.[/quote] Yes, I misused an XY-plot; the x-values where set to rand(0.8,1.2). Overlaying was done in Photoshop, of course. ![]()