Hi all,
I have a problem with data displayed on XY plot, see below. One of the two lines continues back to the 0hr from the 72hrs but there is no data for this.
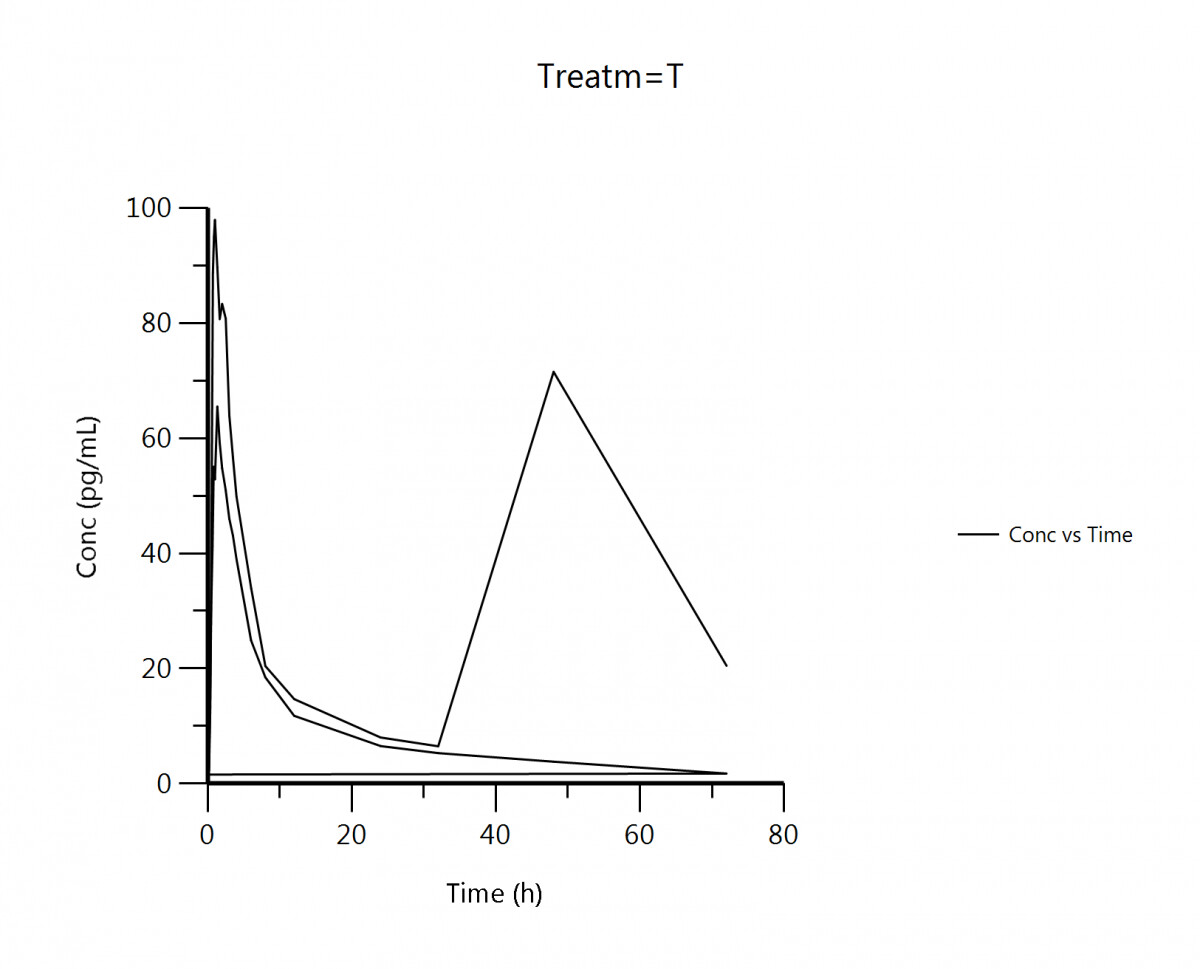
Ideas? Did I miss something? Phxproj is attached.
Thanks, Jan.
Hi all,
I have a problem with data displayed on XY plot, see below. One of the two lines continues back to the 0hr from the 72hrs but there is no data for this.
Ideas? Did I miss something? Phxproj is attached.
Thanks, Jan.
Hi Jan,
The project doesn’t appear to be attached. Can you try attaching it again?
Hi Ana,
sorry about that. I hope this time will be uploaded succesfully.
Jan.
test.phxproj (72.6 KB)
input.xls (20 KB)HI Jan, I think what you were missing was setting Subject as the Group ID.
please look at the attached plot and see if that is what you wanted.
without subject identified as a group or other mapping the line joins all the requested points
Simon
Hi Simon,
that is exactly what I wanted. Thanks a lot, I appreciate your support!
It is interesting that my method without subject identified as a group worked with no problem for another datasets…
Anyway, thanks again!
Have a nice day, Jan.
I want to plot a set data after BID dosing (12 hours apart). the concentrations were quantifiable in the samples up to 12 hours post the first daily dosing, after the second daily dosing (at 12 hours), sample was only collected at 24 hours after the first daily dosing (i.e. 12 hours after the second daily dose). So I would like to plot the data with the line not connected between 12 hours and 24 hours. Can you let me know if I can do this using XY plotting within WNL?
Hi Wei Shi, I would construct a variable DoseNo for dose number withhin the day and then use that as a group variable, see the attached project. Plot A uses time from first dose which what I think you want but Plot B using time since last dose may also be useful.
BID_NoSample.phxproj (170 KB)