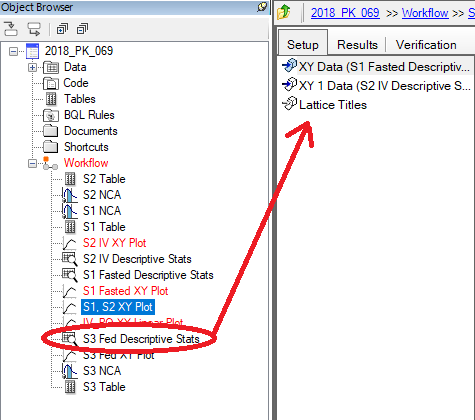
I have an XY Plot that has two data inputs but I would like to add a third dataset to this plot. I can’t figure out how to do this. Can someone help?
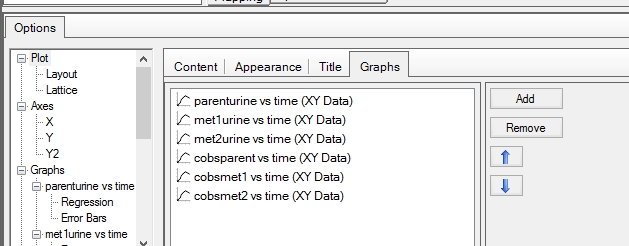
Hi Randy, this is pretty simple. Go to the Options panel at the bottom of the plot.
Click Plot at the root of the ‘tree’, choose Graphs Tab and then Add.
Another input dataset is now expected on the setup tab;
Also p143 of the Phoenix Data Tools and Plots Guide.pdf for version 8.1
Simon.
ah I got it now, thank you!